Exploring Cost-Effective Deployment Strategies for Gulf Stream Energy
Published in NC Renewable Ocean Energy Program (NCROEP), 2016-2017 , 2016
Offshore Gulf Stream currents are a potentially significant source of low carbon electricity for the NC grid; however, there is no commercial experience with such a technology. As a result, there are large uncertainties associated with the future economic competitiveness of electricity derived from the Gulf Stream. The goal of this project is to develop an investment strategy that considers spatiotemporal variability in Gulf Stream currents and enables the deployment of a large turbine arrays at minimum LCOE. This goal motivates two major research tasks: (1) apply portfolio optimization techniques to identify the optimal combination of multiple sites that produce the minimum LCOE or maximum electricity generation over a specified time horizon; and (2) using the optimal portfolio of Gulf Stream sites, test the performance of Gulf Stream energy against other energy sources of electricity, while accounting for uncertainty in Gulf Stream investment and operational costs as well as future state energy policies.
In our study, the designed portfolio represents the allocation of installed turbine capacity across sites within the study domain. We wish to achieve a pre-determined system target capacity factor (the expected return) while minimizing total variance (system risk). In addition, we added the following constraints: (1) the number of turbine units installed in a single grid cell must be an integer and cannot exceed the maximum units per grid cell, (2) the investor may limit the number of selected grid cells within an appropriate range, and (3) the investor may fix the total installed capacity of the project. In addition, the anchoring system can only be installed where the seabed depth is less than 2500 m due to technical limitations. Therefore, we assume that the turbines can only be installed where the seabed depth is between 100 m and 2500 m.
We proposed using an optimized portfolio of sites developed above to represent Gulf Stream energy within an energy system model, and to apply stochastic optimization to address uncertainties that can affect the future economic competitiveness of Gulf Stream energy in North Carolina. We consider uncertainty in natural gas prices, future environmental policy, and marine turbine investment cost within the event tree. With regard to policy, we consider a more aggressive state-level renewable portfolio standard and EPA’s Clean Power Plan for North Carolina. We then perform stochastic optimization to investigate the conditions under which Gulf Stream turbines should become a part of North Carolina’s long-term energy plans. To perform this work, we use Tools for Energy Model Optimization and Analysis (Temoa), an open source framework to conduct energy systems analysis. We refine the open source North Carolina dataset that was developed previously. Temoa was designed to operate in a high performance computing environment and can therefore solve large stochastic models.
DeCarolis, J.F. (PI), de Queiroz, A.R. (co-PI), Exploring Cost-Effective Deployment Strategies for Gulf Stream Energy, Funded by the UNC Coastal Studies Institute, Renewable Ocean Energy for North Carolina Program, 2016-2017

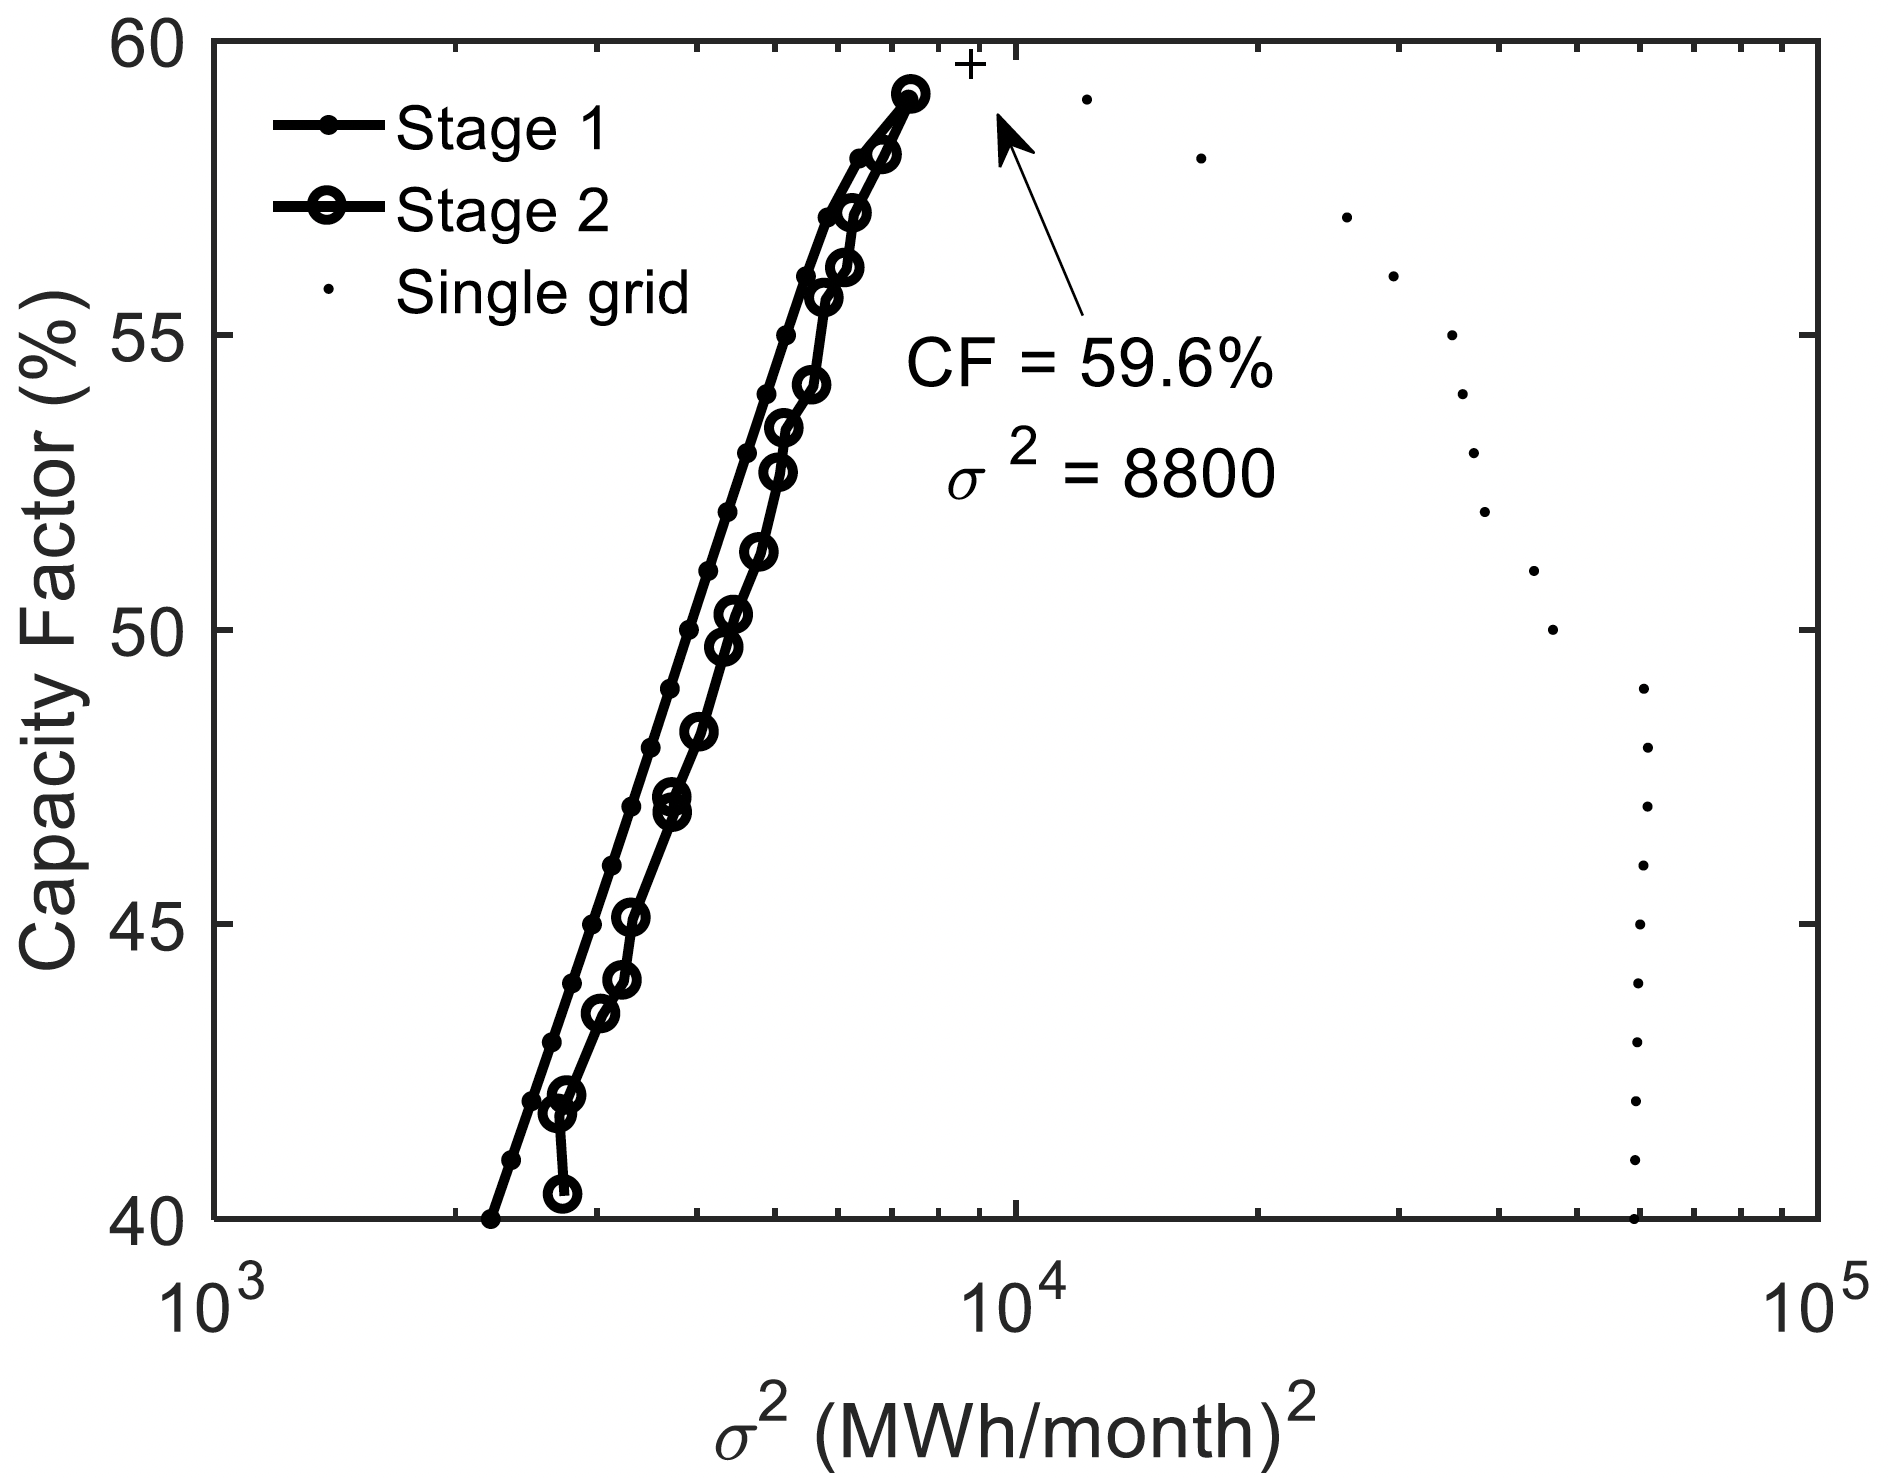
Results from the portfolio optimization. Stage 1 results represent the optimal portfolio without any integer constraint on the number of turbine units, while Stage 2 results use the candidate sites selected from Stage 1 and include the integer constraint. The scattered dots to the right indicate the minimum variance among individual grid cells with the same capacity factor targets rounded to the nearest percent.

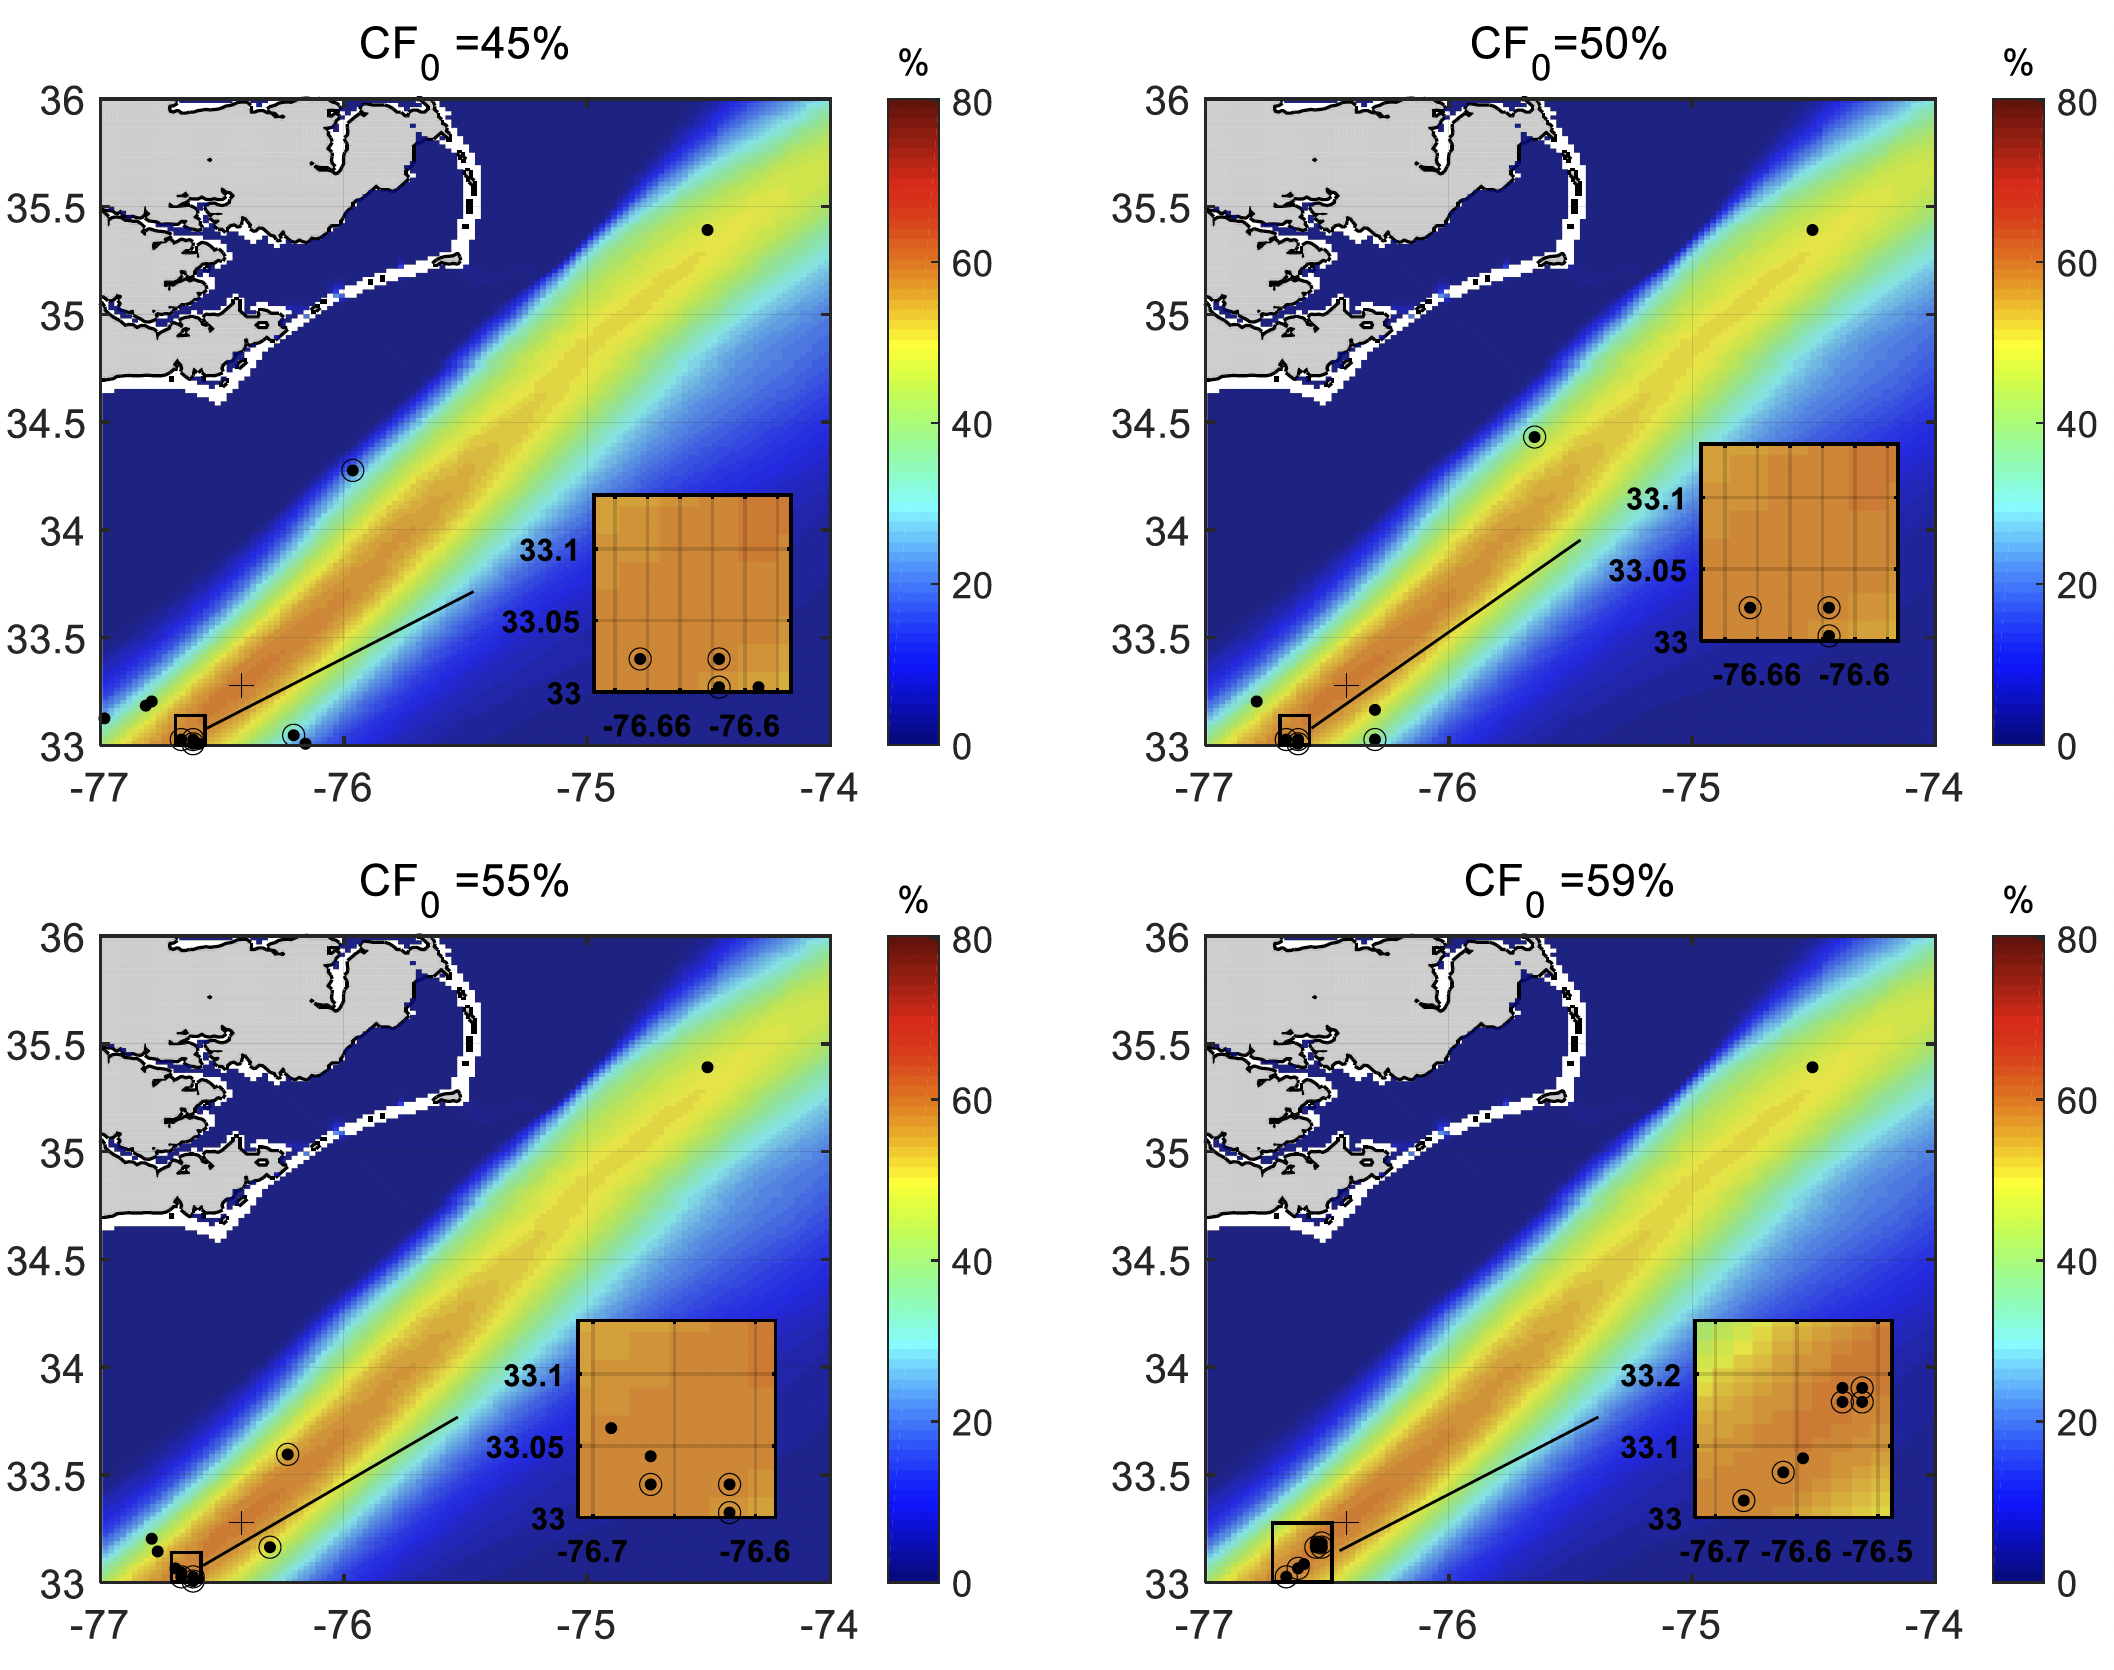
Selected sites within the optimal portfolios at different minimum capacity factor targets. The filled circles on each figure indicate the location of installed capacity in Stage 1 solutions, while the open circles indicate installed capacity in Stage 2 solutions. For reference, the cross indicates the location of the site with the maximum six-year capacity factor. The background color shading represents the six-year average capacity factors (CF) from 2009 to 2014, and the inset provides an expanded view of the selected sites near 33° N and 77° W.

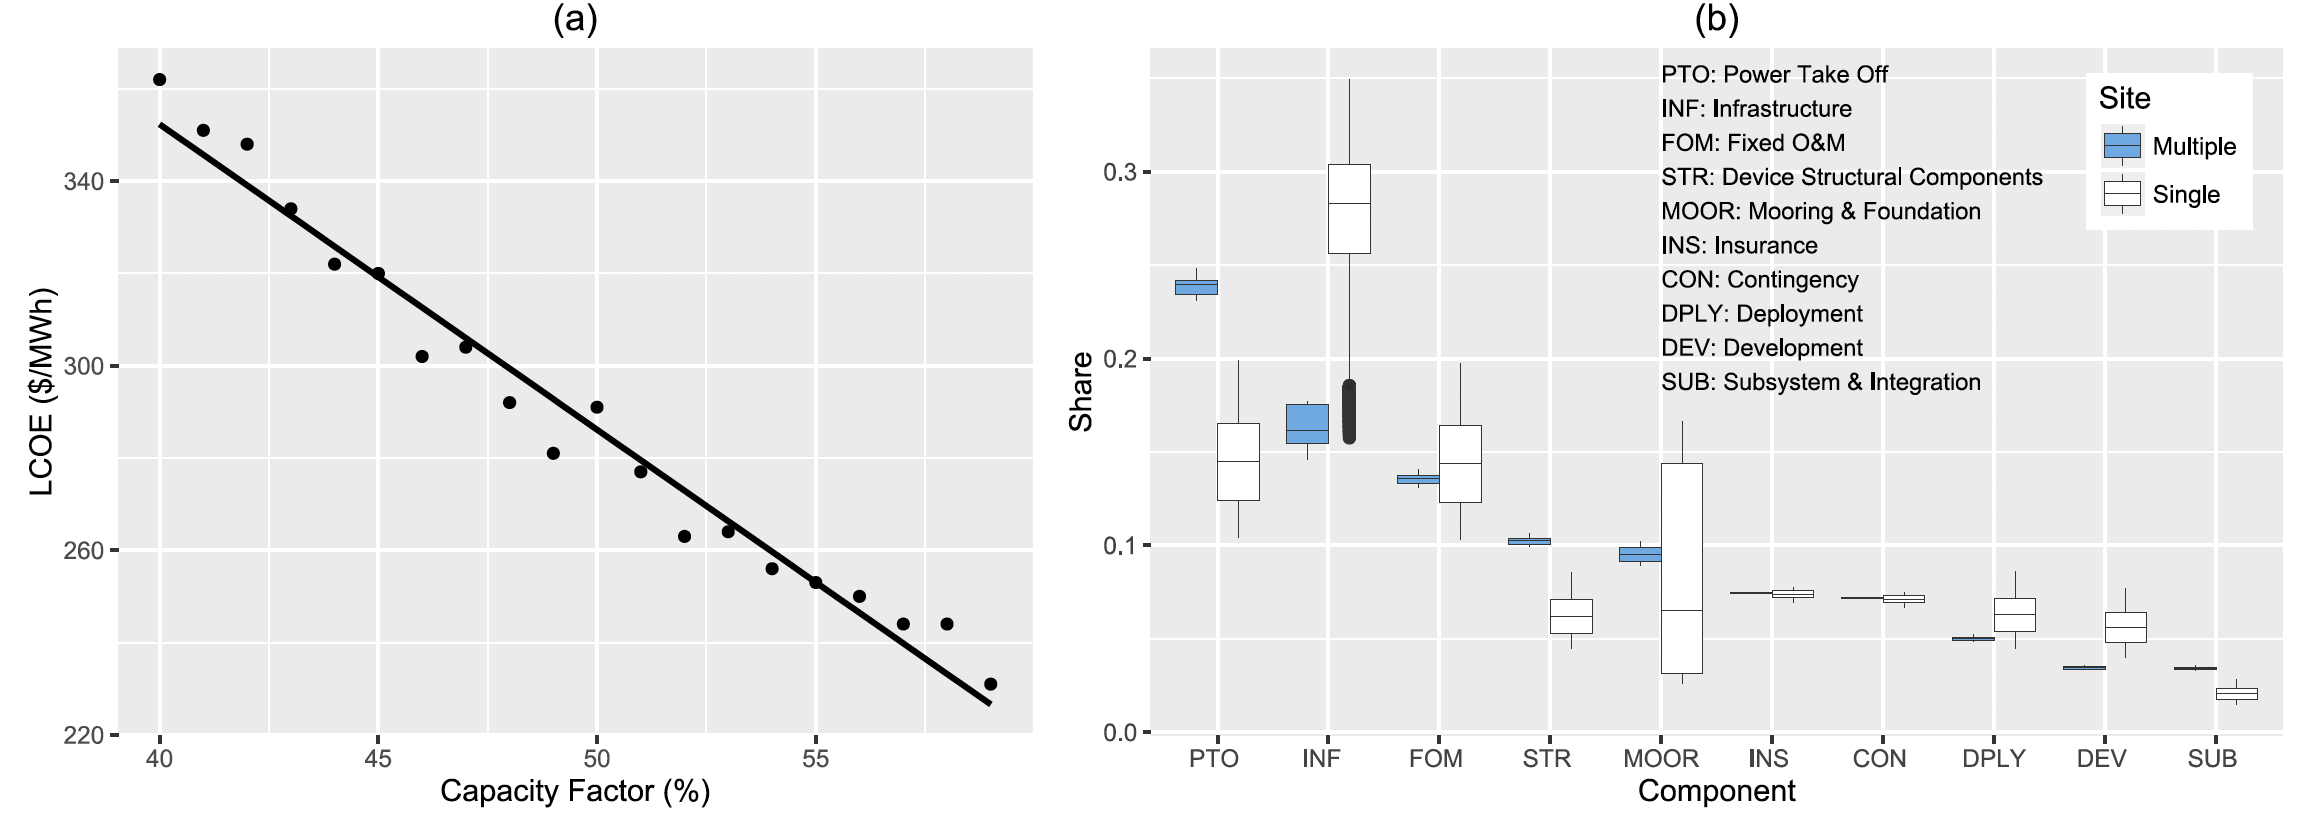
LCOE analysis for the portfolios from the MVP model. (a) LCOE calculated ex post as a function of the capacity factor target in the portfolio optimization. (b) Box plot showing the share of LCOE attributable to different cost components in both the single site and portfolio cases, ordered from highest to lowest share in the portfolio case. The edges of each box represent the 25th and 75th percentiles, and the whiskers extend to the maximum and minimum values.
